As consumers, we have all discovered a brand via social media or looked at reviews before buying a product at some point.
But the fact is that it is difficult for businesses to measure the direct impact of user-generated content.
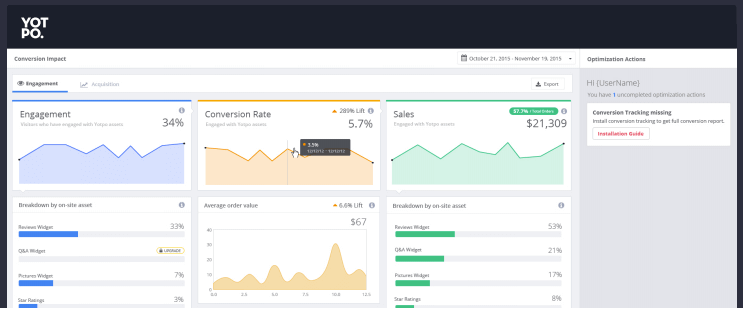
The Conversion Dashboard allows companies to clearly see how much of their engagement, traffic and sales are being driven by each of their on-site UGC widgets and off-site UGC channels.
How To Measure The ROI Of Your Customer Content With The Conversion Dashboard
The Conversion Dashboard allows you to see the direct impact UGC has on your customers’ shopping experience, as well as on how much they are spending.

With metrics related to engagement, conversion, sales and acquisition, you can see what is working well and where you have room to test and optimize.
Let’s take a look at what insights each section of the dashboard provides.
See what else you can do with Yotpo Analytics.
Engagement
The Engagement section of the Conversion Dashboard shows you what percentage of your total site visitors are engaging with your UGC widgets.
By knowing which widgets draw the most attention, you can make informed decisions about where to display them, what they should look like, and how they should impact the shopper experience.
Conversion
The Conversion Rate section provides data on site visitors who ended up making a purchase.
In this section, the Conversion Dashboard visualizes the difference in activity between customers who engaged with UGC before making their purchase, and those who did not engage with UGC before making their purchase.
It does this with three main metrics: conversion rate, average order value, and time on site.
Sales
The Sales section shows you how much money out of your total sales came from customers who engaged with UGC, and what percentage that represents out of your total sales.
Acquisition
The Acquisition section allows you to measure how much direct traffic arrives to your site from external UGC channels.
This may include customers sharing their reviews or pictures via social media, upselling in UGC request emails, coupons in exchange for customer content, and other social channels.
Takeaways
Quantifying the impact that customer content like reviews, customer photos, and Q&A has on your business can be a challenge.
The Conversion Dashboard allows you to measure the ROI of your customer content, see how it impacts your business, and ensure that you are making the most of UGC on and off your site.


