YOTPO REPORT
SMS Benchmarks for eCommerce
Get insights from 3,000+ eCommerce brands that use SMS to drive revenue.  Check the numbers, see how you stack up, and adjust your strategy for optimal results.
Benchmarks
By Industry
Industry
CTR
Conversion Rate
Revenue per Message
Unsubscribe
Fashion
Health & Beauty
Food & Beverages
Animal & Pets
Entertainment
Home, Garden
Sports & Outdoors
Baby & Toddler
Jewellery
8.70% - 9.00%
20.10%-25.10
08.70%-12.60
20.80%-25.70
20.80%-25.70
20.80%-25.70
20.80%-25.70
20.80%-25.70
20.80%-25.70
8.70% - 9.00%
20.10%-25.10
08.70%-12.60
20.80%-25.70
20.80%-25.70
20.80%-25.70
20.80%-25.70
20.80%-25.70
20.80%-25.70
8.70% - 9.00%
20.10%-25.10
08.70%-12.60
20.80%-25.70
20.80%-25.70
20.80%-25.70
20.80%-25.70
20.80%-25.70
20.80%-25.70
8.70% - 9.00%
20.10%-25.10
08.70%-12.60
20.80%-25.70
20.80%-25.70
20.80%-25.70
20.80%-25.70
20.80%-25.70
20.80%-25.70

The key to higher CTR and CVR? Sending the right message at the right time!
With Yotpo’s advanced, AI-powered segmentation and scheduling tools, you’ll send timely, ultra-tailored texts – for maximum conversions.

Benchmarks
By Geo
Industry
CTR
Conversion Rate
Revenue per Message
Unsubscribe
US
EMEA
ANZ
8.70% - 9.00%
20.10%-25.10
08.70%-12.60
8.70% - 9.00%
20.10%-25.10
08.70%-12.60
8.70% - 9.00%
20.10%-25.10
08.70%-12.60
8.70% - 9.00%
20.10%-25.10
08.70%-12.60

Global reach and unmatched deliverability: Yotpo EMEA merchants enjoy the highest CTR and CVR, while ANZ brands have the highest revenue per message.
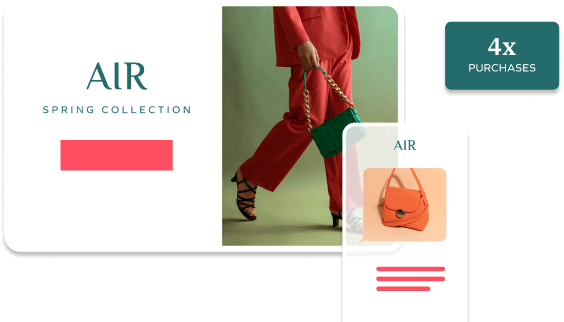
Boost conversions and get up to 20x ROI with Click-to-Buy campaigns.

Benchmarks
By Monthly Order Volume
Industry
CTR
Conversion Rate
Revenue per Message
Unsubscribe
401-1,000
1,001-3,000
3,001-10,000
10.001 - 30.000
30.001 - 50.000
50.001+
8.70% - 9.00%
20.10%-25.10
08.70%-12.60
20.80%-25.70
20.80%-25.70
20.80%-25.70
8.70% - 9.00%
20.10%-25.10
08.70%-12.60
20.80%-25.70
20.80%-25.70
20.80%-25.70
8.70% - 9.00%
20.10%-25.10
08.70%-12.60
20.80%-25.70
20.80%-25.70
20.80%-25.70
8.70% - 9.00%
20.10%-25.10
08.70%-12.60
20.80%-25.70
20.80%-25.70
20.80%-25.70

Don’t compare apples to oranges! Check out the main SMS campaign benchmarks divided by order volume to see how you stack up against brands your size. 

Benchmarks
By Types of Flows
Industry
CTR
Conversion Rate
Revenue per Message
Unsubscribe
New
Subscriber
Abandoned
Checkout
Customer
Winback
Browse
Abandonment
8.70% - 9.00%

20.10%-25.10

08.70%-12.60

20.80%-25.70

8.70% - 9.00%

20.10%-25.10

08.70%-12.60

20.80%-25.70

8.70% - 9.00%

20.10%-25.10

08.70%-12.60

20.80%-25.70

8.70% - 9.00%

20.10%-25.10

08.70%-12.60

20.80%-25.70

Don’t compare apples to oranges! Check out the main SMS campaign benchmarks divided by order volume to see how you stack up against brands your size.