More than 55% of all customers who buy online engage with user-generated content like customer reviews, customer photos and Q&A before making their purchase.
But it can be difficult to pinpoint exactly what is leading to the increased conversion rates and engagement for your business; and more importantly, how you can identify opportunities to optimize social proof.
Here are the metrics you should keep track of to measure your social proof marketing ROI, along with some best practices for collecting and managing customer content.
Measure uplift in engagement, conversion rate and sales from UGC
Clearly seeing the uplift in on-site engagement, conversion rate, sales and acquisition traffic will show you the value and opportunities user-generated content brings to your business.
Engagement
A lot of our customers ask the question: Do shoppers really look at user-generated content?
By taking a bird’s-eye view of your on-site engagement you can see exactly what percentage of your total site visitors engage with UGC.
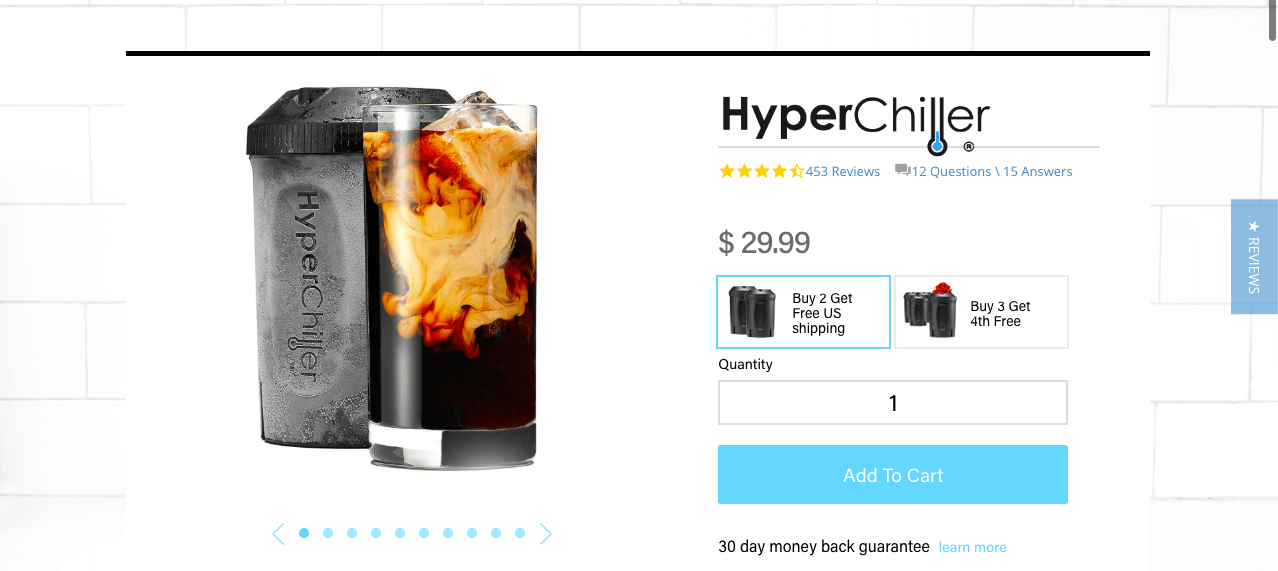
There are tons of opportunities for shoppers to engage with user-generated content across your site, whether you are using a reviews tab, star ratings, and links to reviews and customer Q&A on product pages like HyperChiller …

Shoppable Instagram with UGC on the homepage like Alala …

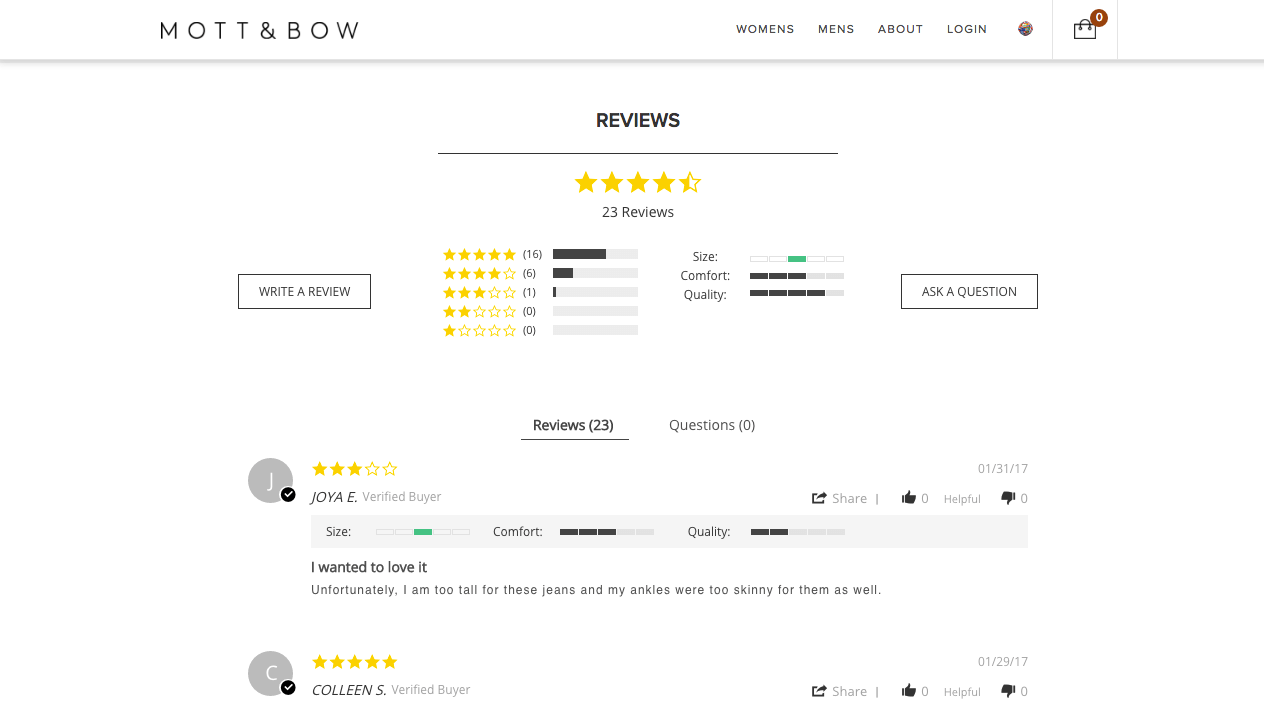
Or customized rating for things like size, comfort and quality like Mott&Bow …

When you know how many visitors are actively engaging with consumer-generated media on your site, you can see exactly how effective your UGC widgets are.
Conversion
A second question a lot of our customers ask is: Does UGC really have an impact on my business?
The conversion rate uplift shows you what percentage of people who bought something on your site also interacted with UGC as part of their online shopping experience.
Conversion rate uplift is the comparison between the conversion rate of customers who interacted with UGC on your site before buying vs. the conversion rate of customers who did not interact with UGC before buying.
We took a look at the average eCommerce conversion rate uplift across several industries, as well as for eCommerce as a whole.
The video below explains conversion rate uplift data derived from more than 200,000 stores and more than 163 million orders.
In the video we see that user-generated content leads to a significant uplift in conversion rate for every industry.
- The eCommerce average for conversion rate uplift from displaying UGC is 161%
- The apparel industry sees the greatest conversion rate uplift with 207%
Yotpo Analytics shows you this kind of data for your specific store and your specific customer base for any given period of time.
Sales
The best way to see if you are getting the most out of a given UGC widget is to compare the percentage of site visitors engaging with a given widget with the percentage of sales coming from customers who engaged with that same widget.
You are in good shape if the percentage of sales is greater than the percentage of engagement.
For example, if 35% of site visitors engage with your reviews widget, and 55% of your sales came from customers who engaged with your reviews widget, then your reviews widget is bringing positive ROI.
Keeping track of how much money came from customers who engaged with UGC allows you to put an actual dollar value on social proof.
Acquisition
User-generated content in acquisition channels also has a measurable impact on your business that you can track.
Direct traffic, customer engagement, conversions and sales from acquisition channels paint a picture of how much social proof impacts your business.
Examples of UGC in acquisition channels include:
- Customers sharing their own reviews and photos on social media
- Email upsells in seasonal communications with your customers
- Coupons in exchange for submitting customer content
- And more!
Data-Backed Tips For Leveraging Social Proof
In order to build a smart UGC strategy, you need to get the content in the first place.
Most shoppers will happily write reviews or send photos, but you have a small window of opportunity to grab their attention.
Data can help you maximize this opportunity so that you are able to get the social proof you need.
How to collect more content
The most common (and effective) way to get customer content like reviews, photos, and Q&A is simple: just ask!
The best way to ask is in an email after a customer interaction has taken place, like a purchase.
Data from more than 200,000 businesses shows that on average, 6-8.5% of customers submit content when emailed for it after purchase.
But we took a deep dive into the data to see how businesses can increase that number.
The two most important aspects of UGC requests to optimize are what you’re saying and when you’re saying it.
What you’re saying
Optimize subject lines so that more customers open your emails and send in UGC.
The video below discusses different ways to update your email subject lines, and how those tactics impact UGC response rates in different industries.
For example, using an exclamation point in subject lines works great for food and tobacco companies–they see an 83.5% increase in reviews. But for electronics, it led to a 30% decrease in reviews.
Using the store name in the subject line led to a solid increase in reviews for health & beauty, sports, and electronics businesses, but it’s a disaster for food and tobacco, leading to a 74% decrease in reviews.
These differences between industries highlights the importance of seeing data for your own store.
When you’re saying it
People are busy. They’re on the go and have tons of things competing for their attention and time.
Customers will give you the social proof you need, but you have to make it easy for them.

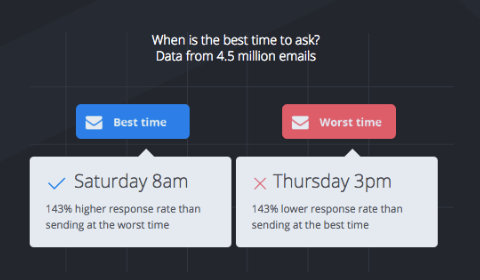
For most businesses, the best time to ask is Saturday at 8am, and the worst time is Thursday at 3pm.
How to manage your content
Customers are communicating with your eCommerce brand across many different channels.
Their feedback matters, but it’s not always possible to manually check each and every customer question, review, photo, or comment.
Below is a word cloud of the most frequently used words in customer reviews in 2016.

The most commonly used word in reviews is “great,” which is great news for online businesses.
The vast majority of reviews are positive — 94% of reviews are either 4 or 5 stars — and that means that they are extremely valuable content for your business to showcase both on and off your site.
Our analysis of 21 million reviews gave us some insight into the most commonly used words in different industries.
Your customer content gives you real actionable insight into what your specific customer base cares about when buying from your store.
Takeaways
User-generated content is a way for you to learn from your customers and for them to learn from each other.
Amplify your customers’ voices and measure the ROI of your user-generated content so that you can optimize and effectively leverage social proof.


